India is easier to reach than to make resilient
This year I have spent a good deal of time travelling across India, for work and for personal reasons. My journeys rarely begin in London and end in Delhi, Mumbai or Kolkata. Because I come from a small town in Bengal, they usually continue along national highways, through district towns, railway stations, industrial belts, crowded markets and village roads. India looks different from the road than it does in presentations, spreadsheets and GDP headlines.
The evidence of national progress is everywhere. Highways are wider and generally better. New expressways compress journeys that once consumed a day into a few hours. Airports have appeared in cities that barely featured on the aviation map twenty years ago. Railway stations are being rebuilt, faster inter-city trains connect more places, and inexpensive mobile internet and instant payments reach deep into the country. The Indian state and private sector have become much better at building national systems at scale.
The picture changes soon after leaving the expressway. Roads deteriorate, drains overflow, pavements disappear and rubbish gathers beside new infrastructure. Towns are expanding faster than municipal systems can absorb them. Each monsoon exposes the weakness: drains fail, streets flood and entire cities can grind to a halt. A passenger may arrive on a modern train, through a rebuilt station, only to step into a town whose local infrastructure appears to have been neglected for decades.
That contrast captures India’s central investment question. National infrastructure has made hundreds of millions of people economically reachable, but local institutions, human capital and worker productivity have not yet converted that access into broad economic security. India has built many of the rails of a modern economy. Its next phase depends on what people can produce, earn and accumulate while using them.
The Bottom of the Pyramid became a participation class
Nearly twenty years ago, while studying international business, I encountered C. K. Prahalad’s work on the Bottom of the Pyramid. His argument helped redefine emerging-market strategy: companies should regard low-income people as consumers, producers and entrepreneurs, then redesign products and distribution around the constraints of awareness, access, affordability and availability.[1]
India became the natural laboratory. It combined an immense low-income population with weak distribution, limited banking, poor infrastructure and vast unmet demand. The implied development chain was compelling: access would enable participation; participation would support enterprise and income; higher income would advance development.
| BoP condition | What changed | Position today |
|---|---|---|
| Awareness | Smartphones, social media, digital advertising | Mass reach |
| Access | Roads, Aadhaar, bank accounts, mobile networks, UPI | Near-universal rails |
| Availability | E-commerce, digital services, platform logistics | National assortment |
| Affordability | Higher incomes, but thin buffers and limited surplus | Binding constraint |
Table 1. The Four As have not advanced evenly. Sources: Prahalad [1]; World Bank, UIDAI and NPCI [2]–[3].
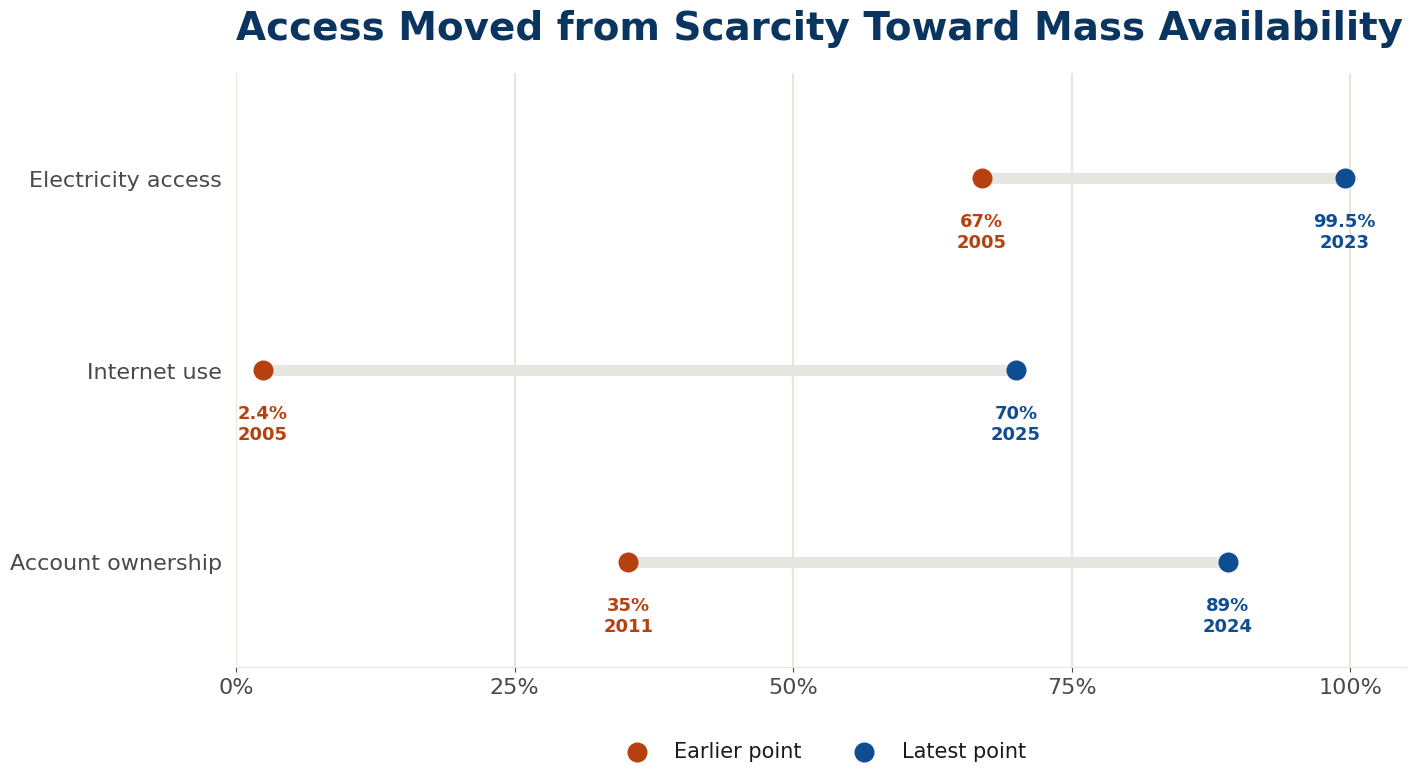
India has transformed three of the four conditions. A person once largely invisible to the formal economy can now hold a digital identity and bank account, receive money instantly, compare prices, find work, sell services, borrow and order goods. Electricity access rose from about 67% of the population in 2005 to 99.5% in 2023; internet use rose from 2.4% to roughly 70%; and adult account ownership rose from 35.2% in 2011 to 89% in 2024.[3]
Access moved from scarcity toward mass availability.
Affordability is harder because it is an outcome, not a rail. Incomes have risen and extreme poverty has fallen sharply, yet discretionary income and financial buffers remain thin across much of the population. Under the World Bank’s current 2021 PPP international poverty lines, 5.3% of Indians were below $3.00 a day in 2022–23 and 23.9% below the lower-middle-income line of $4.20; roughly four-fifths remained below the upper-middle-income line of $8.30. The disappearance of mass extreme poverty is not the arrival of mass affluence.[4]
India has therefore moved much of the way from economic exclusion to participation. The new participation class is connected, active and commercially visible. Its members transact, travel, borrow, consume entertainment and work through organised networks. Their activity creates enormous markets. Their prosperity, however, depends on what those markets do not automatically provide: productivity, skills, savings and resilience.
The market is three economies, not one
India’s nearly 1.5 billion people do not constitute a single consumer market. They form three economic worlds that increasingly occupy the same cities, roads and digital platforms while contributing different resources to the economy. The categories below are analytical, not official social classes. They divide households by income and economic function so that investors can distinguish capital, discretionary demand and labour supply.
| Capital India | Consumption India | Workforce India | |
|---|---|---|---|
| Population anchor | ~56m | ~432m | ~928m |
| Household income | >₹30 lakh | ₹5–30 lakh | <₹5 lakh |
| Average income per person | ~₹6.8 lakh | ~₹1.95 lakh | ~₹48,000 |
| Consumption at PPP | ~$20,000 | ~$7,400 | ~$2,500 |
| Reference economy | Central Europe | Indonesia | Lower-income economies |
| Economic resource | Capital, ownership | Skills, savings, demand | Labour, production, mass demand |
| Main constraint | Capital allocation | Income and assets | Productivity and security |
Table 2. Author’s segmentation using PRICE household-income anchors for 2020–21. PPP values and international comparisons are illustrative private-consumption equivalents, not comparisons of public services or overall living standards [5]–[6].
Capital India is roughly Italy-sized: 50–60 million people with substantial disposable income, assets, business ownership or senior professional earnings. It supplies a disproportionate share of private capital, savings and premium demand. Consumption India comprises roughly 430 million people supported by professional skills, formal or semi-formal work, established businesses and meaningful discretionary income. It is larger than the United States and approaches the European Union in population. Workforce India contains more than 900 million people across agriculture, construction, manufacturing, driving, delivery, security, domestic work, small trade and informal services. Its defining feature is not always absolute poverty; it is low surplus and high vulnerability to an interruption in earnings.[5]
Purchasing power matters more than population alone. Capital India has private consumption capacity broadly in the range of parts of Central Europe. Consumption India is a European-sized population consuming at roughly Indonesian levels. Workforce India operates at private-consumption levels more characteristic of lower-income economies, but inside a country with much better national infrastructure, payments, telecoms, pharmaceutical supply and employment opportunities than those numbers alone imply.[6]
The upper third accounts for roughly two-thirds of household spending.
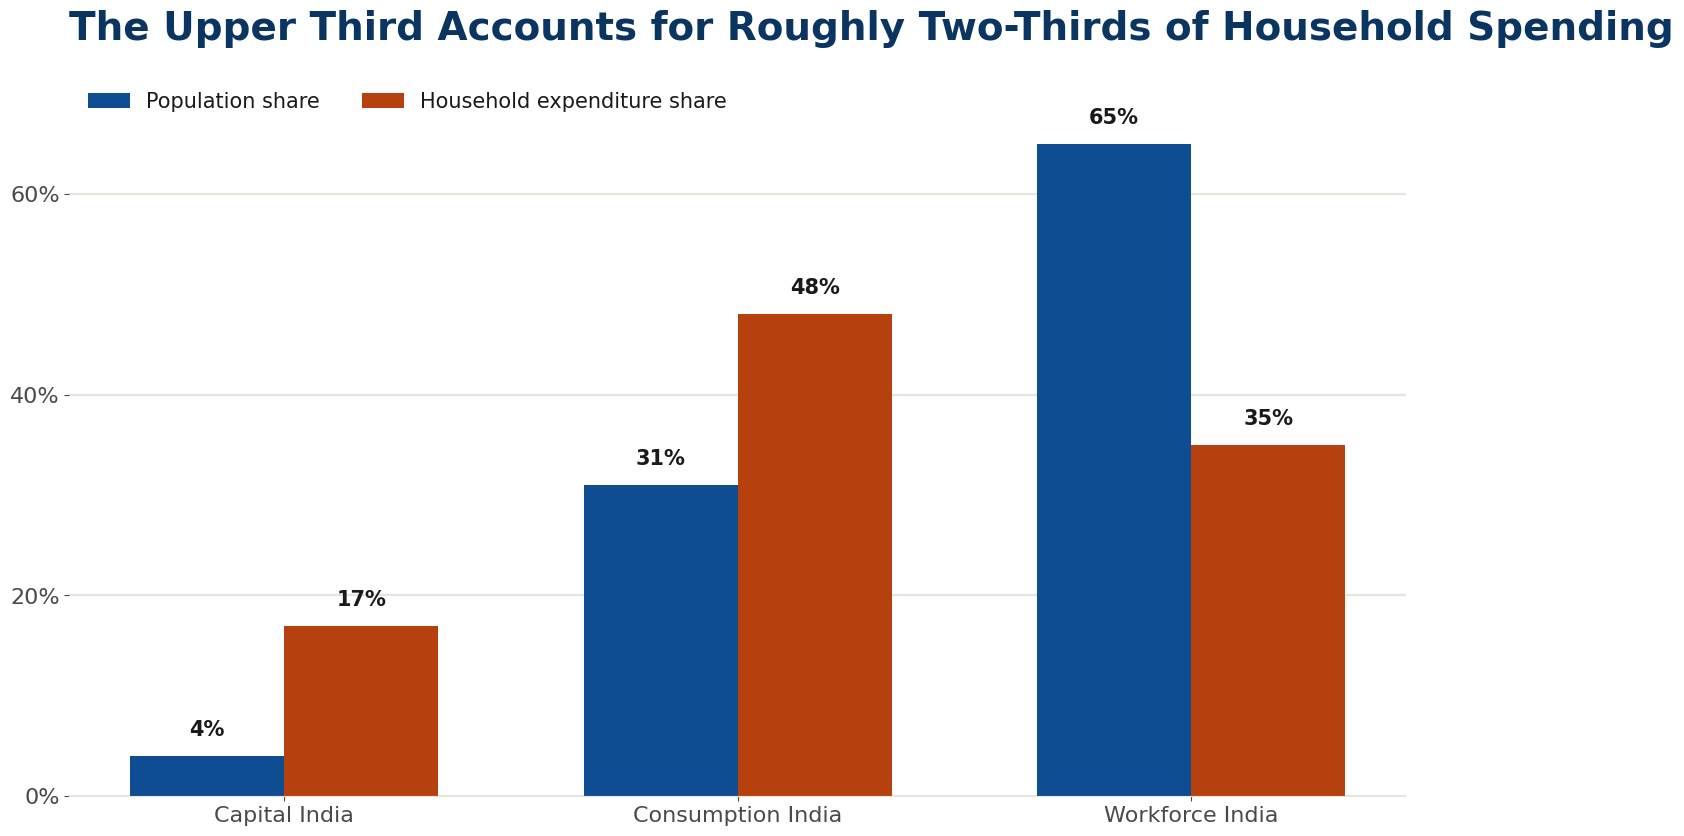
The commercial implication is simple: India’s population is much larger than its economically addressable market for most products. A premium financial-services company, luxury hotel chain or premium carmaker is not addressing 1.5 billion consumers; its immediate market may resemble an Italy-sized affluent population. A mass brand, insurer, restaurant chain or private-education provider primarily competes for Consumption India: European in scale, but with emerging-Asian purchasing power. Telecoms, low-ticket finance, value retail and FMCG reach further into Workforce India, where price, pack size, financing, durability and total cost of ownership dominate.
This helps explain the apparent contradictions of modern India. Premium hotels can be full while hundreds of millions remain highly price-sensitive. Luxury cars and SUVs fill the streets while motorcycles remain indispensable. High-end towers and gated societies can stand beside informal settlements whose residents supply much of the labour that keeps those towers functioning. Different Indias are growing simultaneously. A single national consumer story misreads all three.
Platforms integrated the tiers but mostly monetised coordination
The three Indias increasingly transact in the same economic geography. Capital India supplies investment and premium demand; Consumption India supplies skilled labour, household savings and most discretionary consumption; Workforce India supplies much of the labour behind agriculture, manufacturing, construction, logistics and everyday urban services. Digital platforms organise the interfaces between them.
Ride-hailing aggregates drivers and vehicle capacity. Quick commerce combines warehouses, riders, inventory software and dense urban demand. Home-services platforms add discovery, scheduling, reputation and payment to fragmented vocational labour, while staffing firms recruit and deploy frontline workers for enterprises. The common structure is simple: labour from Workforce India, combined with capital and technology, serves demand in the upper two Indias.
Quick commerce makes the mechanism visible. A higher-income household pays to avoid a twenty-minute shop visit because its time is valuable. A delivery worker’s time has a lower market price. Technology matches the two and captures part of the difference. India’s income gaps therefore support labour-intensive convenience models that are harder to sustain where wages sit closer to consumer incomes.
This extends the original BoP thesis. Sachet pricing, telecoms, low-cost devices, digital payments, e-commerce and financial inclusion widened the consumer market. Many of India’s most scalable new businesses, however, have expanded on the labour side: they make fragmented work easier to discover, verify, schedule and pay for.
Uber, Rapido, Swiggy, Zomato, Blinkit, Zepto, Porter, Shadowfax and Urban Company create a market architecture in which labour itself becomes easier to sell. Quess and TeamLease perform a related function through more formal contractual structures, recruiting, verifying, deploying and paying large frontline workforces for enterprise customers.
The enabling stack matters. Cheap mobile data makes workers reachable. Aadhaar and KYC make identity verifiable. Bank accounts and UPI make payment cheap. GPS makes location observable, ratings create reputational capital, and platforms provide customer discovery. Credit can then finance the productive asset needed to enter the market. The innovation is institutional as much as technological.
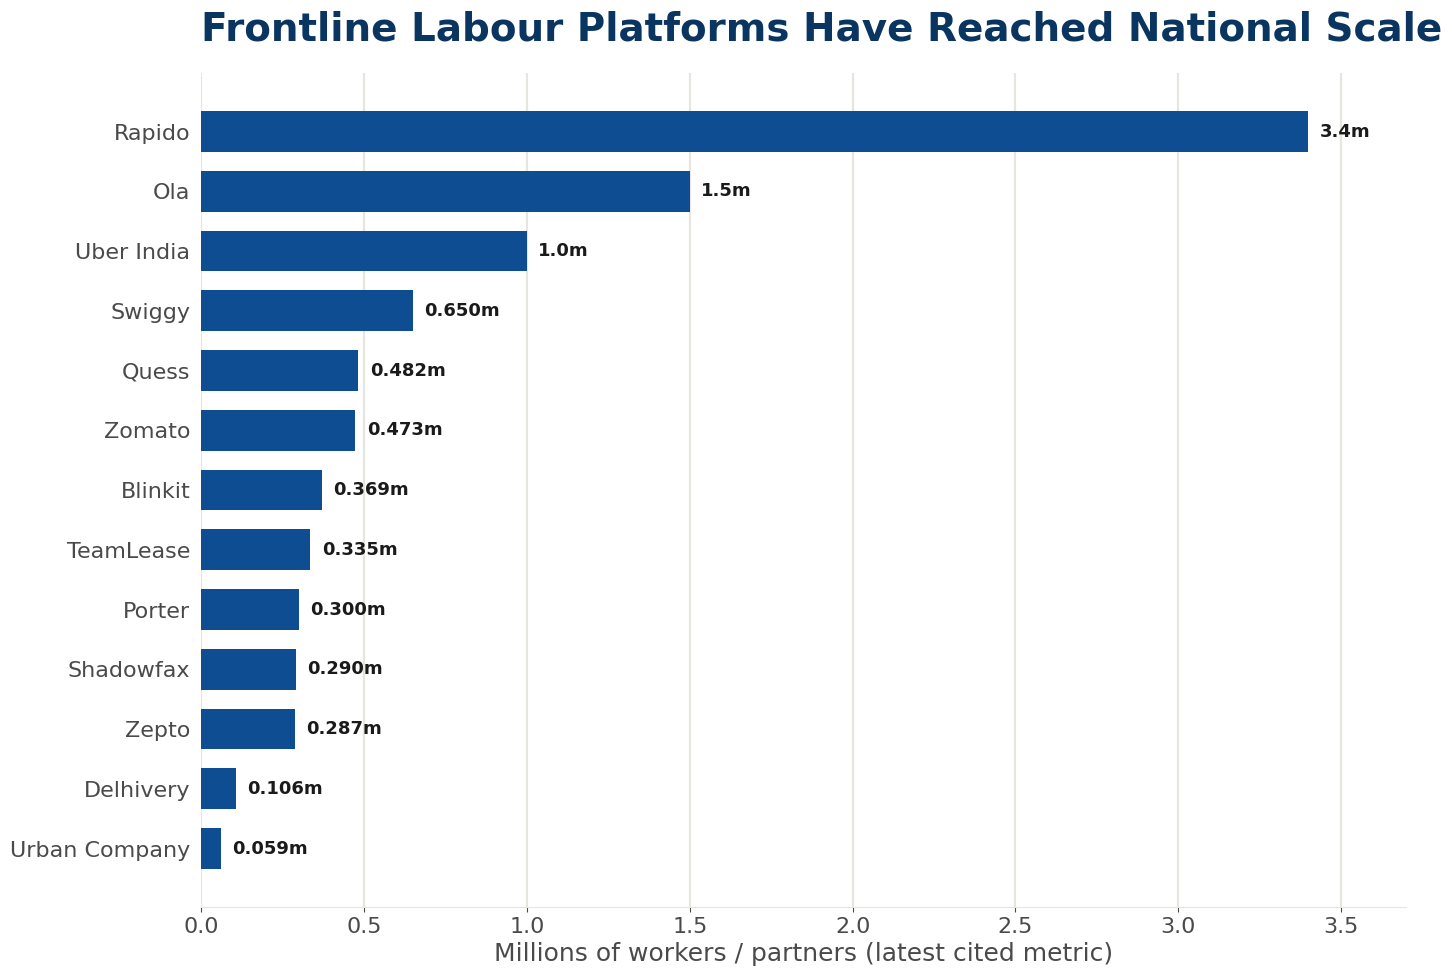
Frontline labour platforms have reached national scale
Selected frontline workforce and livelihood networks associated with Indian platforms and workforce aggregators.
| Company or platform | Model | Cited workforce or partner metric | Relationship or caveat |
|---|---|---|---|
| Rapido | Mobility | 3.4m+ active captains | Gig partner; active captains |
| Ola | Mobility | 1.5m+ driver-partners | Company-stated partner base; not a current active metric |
| Uber India | Mobility | 1.0m+ drivers | Gig partner; company says over one million |
| Swiggy | Food and quick commerce | 650k+ delivery partners | Platform-wide enabling network; current corporate profile |
| Quess | Staffing | 482k+ professionals | Workforce solutions; global or company-wide metric |
| Zomato | Food delivery | 473k avg. monthly active partners | FY25 disclosure |
| Blinkit | Quick commerce | 369k avg. monthly active partners | Q3 FY26 disclosure reported from company metrics |
| TeamLease | Staffing and apprenticeship | 335k total headcount | Q3 FY26 disclosed total headcount |
| Porter | Logistics | 300k driver-partners per month | Monthly transacting partners |
| Shadowfax | Logistics | 290k+ quarterly delivery partners | Quarterly partner metric |
| Zepto | Quick commerce | ~287k avg. active partners | Quarter ended Mar-2026 DRHP metric reported in public coverage |
| Delhivery | Logistics | 106k+ direct and indirect employment | Includes on-roll, off-roll and gig workforce |
| Urban Company | Home services | 59k+ service professionals | Platform service professionals |
Source: company disclosures and investor materials; see note [15]. Metrics use different definitions and reporting periods and are not additive.
These are workforce or livelihood networks, not a national employment count. Workers can multi-home across platforms, and company disclosures use different definitions of active, registered, transacting, employed and enabled workers. The figures therefore cannot be added. The point is organisational scale: a small group of platforms and staffing intermediaries can now coordinate labour pools comparable with those of India’s largest traditional employers.[15]
Labour, credit and welfare complete the participation machine
Platforms are only the visible layer. Underneath them, India has assembled a broader state-finance-platform ecosystem. Digital identity and payments make workers legible to formal systems; finance can turn expected future labour income into a productive asset today; welfare lowers the cash income required for subsistence; and platforms convert fragmented labour into discoverable supply. In 2005, many low-income households sat outside most of this machinery. By 2026, the frictions between the layers had fallen sharply. India has, in effect, built a powerful participation machine. The unresolved question is whether participation compounds.
Start with labour. India’s headline unemployment rate is an incomplete guide to the problem. In July 2026, the Periodic Labour Force Survey reported unemployment of 5.1% for people aged 15 and above, alongside a labour-force participation rate of 55.4% and a worker-population ratio of 52.5%. Yet a person can be classified as employed while working intermittently in family activity, casual work or low-productivity self-employment. That distinction matters for platform economics. If a driver or rider came from open unemployment, platform work is job creation. If the same person came from agriculture, casual labour, informal self-employment or another app, the gain is mainly better matching, utilisation and partial formalisation. NITI Aayog estimated 7.7 million gig workers in 2020–21 and projected 23.5 million by 2029–30, but scale alone does not tell us which effect dominates.[7]–[8]
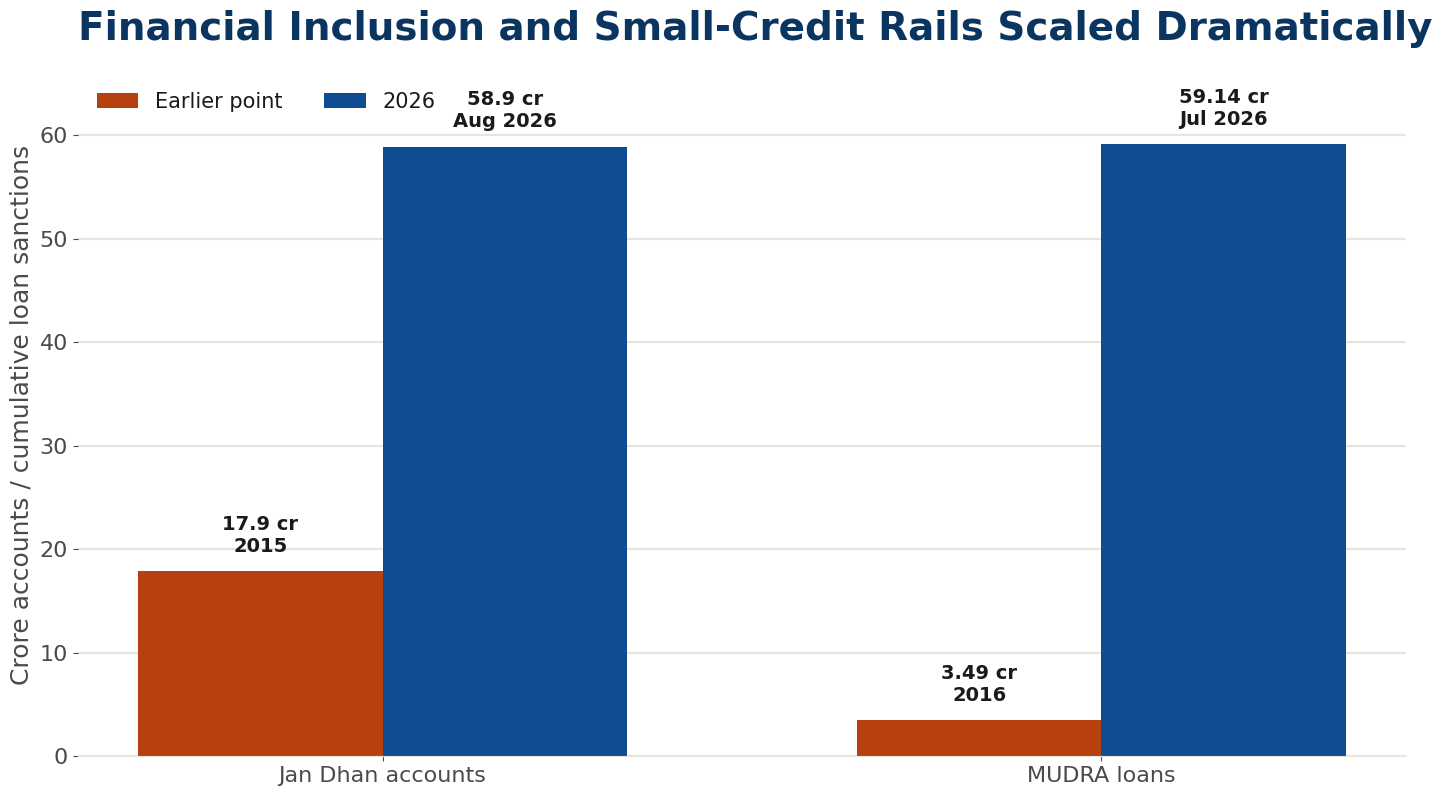
Credit is the second hinge. Many workers possess labour but not the productive asset required to sell it. A motorcycle, auto-rickshaw, smartphone, tools or working capital can bridge that gap. By August 2026, Jan Dhan had 58.90 crore accounts; by July, MUDRA had sanctioned more than 59.14 crore loans cumulatively, worth ₹41.71 lakh crore. The upside loop is straightforward: credit finances an asset, the asset generates platform income, digital inflows create a financial history, and that history can support better credit or a larger asset. But the loop can reverse. Vehicle loan repayments can create dependence on platform income, pushing workers towards longer hours while fuel, maintenance, commissions and depreciation erode headline earnings. For asset-intensive gig work, gross income is therefore a poor measure of welfare; net economic income is the better test.[9]
Welfare is the third hinge. Free food, cash transfers and portable entitlements lower the cash income a household must devote to basic survival. The DBT system has transferred more than ₹53 lakh crore cumulatively across schemes, while free foodgrains under PMGKAY cover about 81.35 crore people. One Nation One Ration Card makes food entitlements portable across the country, reducing one cost of migration for workers who move in search of employment. When less market income is required for subsistence, households can spend more on transport, mobile data, education, healthcare, debt service or consumer goods. That cushions volatile earnings, supports mass-market demand and can make variable-income work easier to tolerate.[10]
But a stronger consumption floor is not a productivity strategy. Welfare can reduce poverty and volatility without raising the market value of an hour of labour; credit can finance a productive asset or merely finance dependence; and a platform can create a market for labour without creating a career. Better matching may reduce idle time, equipment may raise output and welfare may cushion volatility while leaving a worker’s skill, bargaining power and asset position only modestly changed. The question is no longer simply whether a platform ‘creates jobs’, but what kind of productivity the wider system creates and who owns the resulting capability.
The next frontier is productivity that survives the platform
Productivity has three layers. They can reinforce one another, but they are not economically equivalent.
| Productivity layer | What changes | Typical mechanisms | Worker-level test |
|---|---|---|---|
| 1. Utilisation | More paid output from existing time and skill | Matching, routing, scheduling, demand aggregation | Are idle hours lower and net earnings higher? |
| 2. Operational | More output or lower cost per hour | Better tools, workflow software, inventory, finance, quality control | Does the worker retain an efficiency advantage? |
| 3. Human-capital | Higher market value of the hour itself | Training, certification, health, reputation, progression | Can the worker command more elsewhere? |
Table 3. The productivity ladder. The strongest mobility models move workers from utilisation toward transferable operational and human-capital gains.
Utilisation productivity makes an existing capability busier. A driver who spends less time searching for passengers completes more paid trips. Operational productivity improves the production function: better routing, equipment, software, inventory access or working-capital finance allows more output per hour or lowers the cost of producing it. Human-capital productivity raises the market value of a person’s hour through skill, health, certification, reputation or progression into supervisory and entrepreneurial roles.
The ownership question is decisive. If the platform disappears, does the worker retain a credential, customer history, tool, asset, savings balance or demonstrable skill? Or does the advantage vanish with access to the app? The first outcome creates a productive asset that can compound. The second creates dependence on continued matching.
India needs all three layers. Utilisation can improve income quickly, operational tools can raise margins, and human-capital gains create the clearest bridge from Workforce India to Consumption India. The strongest models combine demand with workflow tools, finance for productive equipment, portable certification and a reputation record the worker can take elsewhere.
Mobility, not activity, is the development test
The macro evidence is encouraging but incomplete. Average monthly per capita consumption rose from ₹559 in rural India and ₹1,052 in urban India in 2004–05 to ₹4,122 and ₹6,996 respectively in 2023–24. The figures are nominal and survey methods changed, so the multiples are not measures of real welfare. More tellingly, food’s share of rural expenditure fell from 53.1% to 47.0%, consistent with greater room for non-food consumption. PRICE’s household-income work also points to sizeable real-income gains across the lower half of the distribution, although its estimates differ materially from methods that adjust more aggressively for missing top incomes.[11]
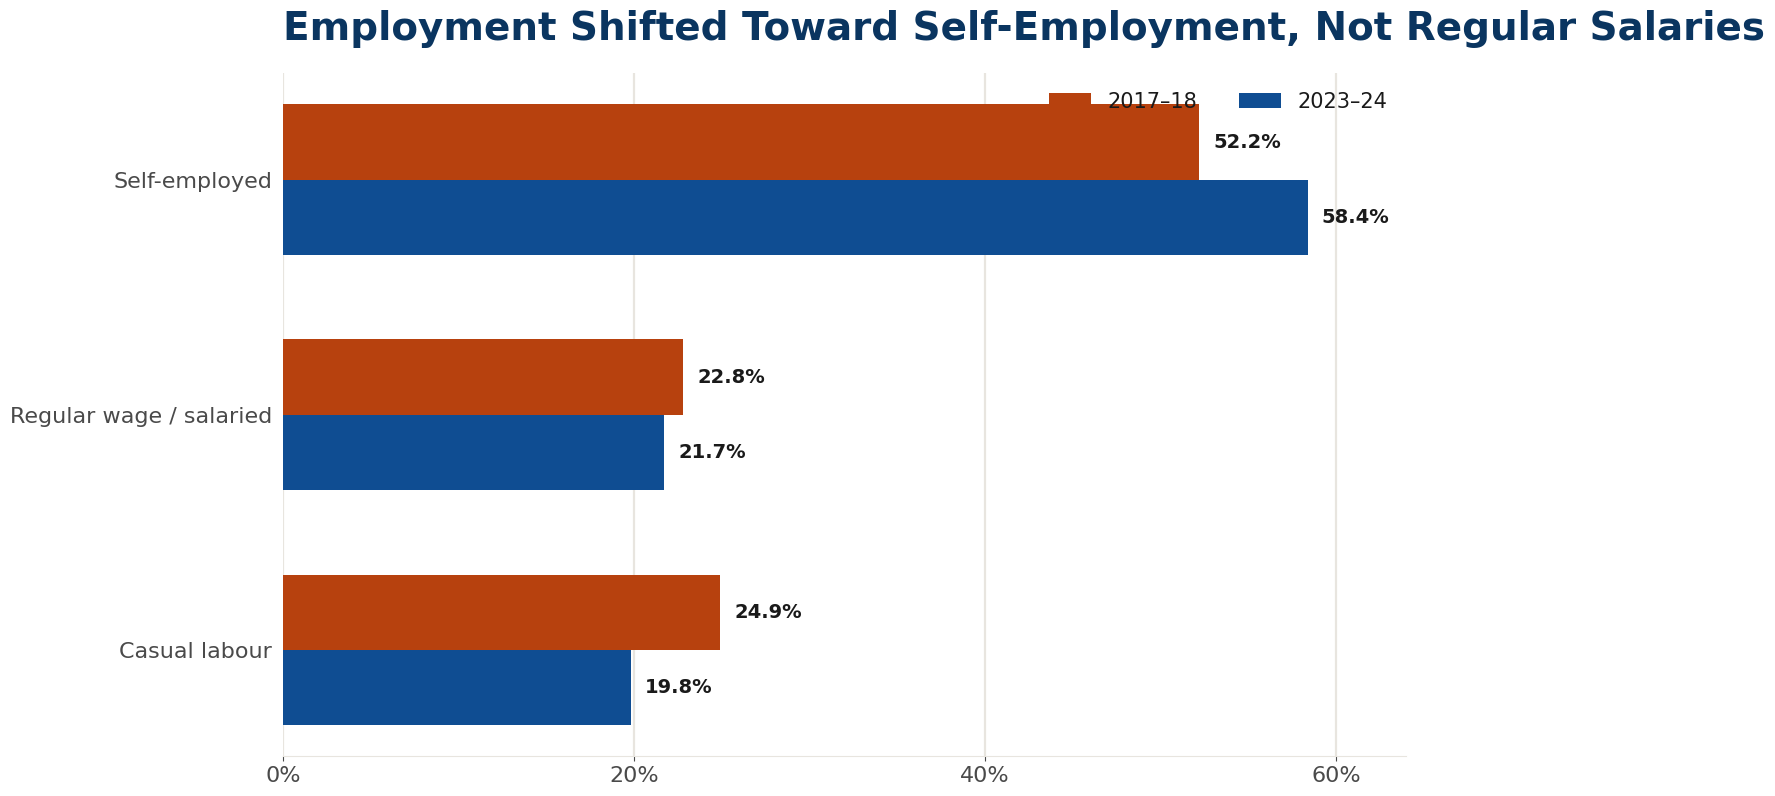
Employment structure warns against declaring the mobility problem solved. Between 2017–18 and 2023–24, the self-employed share rose from 52.2% to 58.4%, while the share in regular wage or salaried employment slipped from 22.8% to 21.7% and casual labour fell from 24.9% to 19.8%. Some self-employment is entrepreneurial; some reflects limited access to stable, productive wage work. The shift is therefore not a clean upgrading story.[12]
Employment shifted toward self-employment, not regular salaries.
Yet activity is not mobility. Absolute mobility means earning and consuming more than before. Occupational mobility means moving into higher-return work. Asset mobility means accumulating savings, equipment, housing or a business. Intergenerational mobility means children achieving materially stronger education and income positions than their parents. Research on India finds substantial variation in upward mobility across regions and social groups; national access rails do not erase local differences in school quality, networks, discrimination, health and state capacity.[13]
The empirical gap matters. National data do not yet establish that platform participation causes long-run occupational or intergenerational mobility. Gross earnings can conceal fuel, vehicle debt, equipment, commissions, unpaid time and income volatility. A platform may still be attractive to workers and investors, but the stronger claim—that it creates a durable ladder—requires cohort evidence on net earnings, asset accumulation, skill portability and progression.[14]
Brazil offers a useful warning without requiring a neat historical analogy. During the 1960s and 1970s, its real GDP grew by roughly 7.3% a year on average and it was widely seen as a future economic power. After the 1982 debt crisis, growth over the next two decades fell to roughly one-third of that pace. Macroeconomic instability and structural weaknesses turned apparently inexhaustible potential into a much less impressive long-run outcome.[16]
India is not Brazil. The narrower lesson is that demography, scale, technology and even high growth do not guarantee prosperity. Prosperity depends on repeatedly converting those advantages into higher productivity, stronger institutions, deeper human capital and greater economic mobility.
Underwriting should follow who pays, who works and what compounds
Population is a poor shortcut for profit pools. The Three Indias framework becomes investable only when joined to the productivity ladder. For every business, the analyst should identify the paying tier, the labour-supplying tier, the source of capital and the owner of the surplus.
| Underwriting question | What a strong answer reveals |
|---|---|
| Which India pays? | The realistic addressable market, price point and demand resilience |
| Which India supplies labour? | Wage assumptions, labour availability and social durability |
| Where does growth come from? | Utilisation, operational efficiency, human capital—or work intensity |
| Who captures the surplus? | Whether economics accrue to consumers, workers, the platform or capital providers |
| What survives outside the platform? | Portable skill, reputation, customers, savings or productive assets |
| Is there a mobility path? | Evidence of progression from Workforce India toward Consumption India |
Table 4. A practical underwriting screen for businesses operating across the Three Indias.
A premium financial-services company may prosper entirely within Capital India. A consumer brand may depend on Consumption India. A value retailer may sell deep into Workforce India. A services platform may organise Workforce India while selling chiefly to the two tiers above. Each can be investable, but their market size, unit economics and social durability differ. The last of those is often omitted from the model.
The most consequential businesses will connect the tiers while strengthening the productive capacity of people moving between them. Opportunities lie in vocational training, affordable healthcare, worker finance tied to productive assets, logistics, housing, small-business software, insurance and platforms that allow reputation and skills to compound. The development loop can then reinforce itself: capital and technology raise productivity; productivity raises income and resilience; income creates consumption and savings; and larger markets attract further investment.
This lens also clarifies the limits of the argument. The Three Indias are an underwriting model, not fixed identities. Households move between them, regional costs differ and official datasets measure income, expenditure and work in different ways. A high-return business need not produce mobility to be legitimate. But when a company claims to benefit from India’s development, investors should distinguish between a model that uses abundant low-cost labour more intensively and one that raises the value and security of that labour.
The bridge must permit upward movement
The original Bottom-of-the-Pyramid thesis deserves a qualified positive verdict. Prahalad correctly recognised that low-income populations were not simply recipients of welfare but potential consumers, workers, producers and entrepreneurs. Once the cost of reaching them fell, markets that had looked commercially inaccessible could become enormous. India has demonstrated that proposition on a remarkable scale.
The infrastructure of participation has changed almost beyond recognition. Roads move goods, digital payments move money, telecommunications move information and platforms match workers, consumers and businesses. Aadhaar, mobile connectivity, UPI, logistics networks and e-commerce have sharply reduced the cost of identification, discovery, payment and coordination. Hundreds of millions of Indians are now economically addressable. But addressability is not prosperity.
The constraint has moved closer to the ground. The next gains will come from schools that impart useful skills, healthcare that protects household balance sheets, towns that can absorb migration, credit that finances productive assets, and businesses that help workers progress from low-productivity occupations into higher-value work.
These improvements are harder to deliver than a national payments rail. A digital system can scale across India in a few years; a good school, clinic or municipality has to work every day. Productive mobility requires health, education, capital, technology, infrastructure and market access to reinforce one another. None of this scales as neatly as software, yet this is where durable mobility is built.
That is the India visible from the road: three country-sized economies sharing national infrastructure and increasingly connected by markets and technology, yet separated by large differences in capital, capability, productivity and resilience. Capital India supplies much of the capital and premium demand; Consumption India supplies skills, savings and the expanding discretionary market; Workforce India supplies a vast reservoir of labour, services and future consumers.
The scope to enlarge the economic pie for all three is enormous, but they cannot develop indefinitely as parallel economies. The opportunity lies in the bridges between them: making it easier for labour, capital, skills, reputation and enterprise to move upward through the system.
Government’s role is to remove friction, provide public goods and make productive activity easier. India has improved many national systems, but local and institutional frictions remain costly: layers of compliance and approvals, difficult land and construction processes, slow contract enforcement and bureaucratic discretion can all discourage the small and medium-sized firms that should absorb workers into more productive employment.
Rapid growth also creates entropy. Urbanisation and industrialisation generate congestion, pollution, waste, pressure on water and housing, and environmental degradation faster than local systems can absorb them. If those costs are ignored, GDP can rise while health, productivity and quality of life deteriorate. The externalities eventually return to the economy.
The private sector has shown what is possible. Mobility, delivery, logistics, staffing and home-services platforms have organised fragmented labour markets by adding discovery, scheduling, verification, reputation and payment. Their most important contribution may not be the app itself, but the institutional layer built around fragmented work.
The opportunity is to extend that architecture into construction, healthcare, elder care, maintenance, manufacturing, hospitality, agricultural services and small-business support. Platforms need not merely match labour with tasks. They can help workers accumulate portable skills, credentials, reputation, financial history and productive assets: a construction worker progressing into supervision, a healthcare assistant earning recognised qualifications, or a technician using verified earnings to finance equipment and eventually a business.
That would take the Bottom-of-the-Pyramid idea beyond access. The objective would no longer be simply to sell to low-income households or use their labour more efficiently, but to build markets that systematically increase the economic value and resilience of that labour.
For investors, this is the more important test of India’s next phase. Another hundred million smartphones, bank accounts or e-commerce users will expand activity. The larger question is whether connectivity becomes productivity and whether productivity becomes upward mobility.
India has already demonstrated an extraordinary capacity to build national infrastructure from the top down. The next phase is more granular and, in many ways, more difficult: improving schools, clinics, municipalities, courts, labour markets, small businesses and local systems of governance from the bottom up. That is also why the opportunity remains so large: so much of the productive infrastructure is still unfinished.
The first great achievement was connecting India’s economic layers. The next is allowing people, skills and capital to move between them. India’s long-term investment case will be decided by the strength of those bridges—and by whether they enable hundreds of millions of people to climb upward, rather than merely work harder where they already stand.
Notes and sources
- [1]C. K. Prahalad, The Fortune at the Bottom of the Pyramid: Eradicating Poverty Through Profits, fifth-anniversary edition, Wharton School Publishing, 2009. The Four As framework is awareness, access, affordability and availability.
- [2]World Bank, India country data and World Development Indicators; Unique Identification Authority of India, Aadhaar Dashboard; National Payments Corporation of India, UPI product statistics. These sources establish the scale of the national identity, payments and infrastructure rails. Source link
- [3]World Bank WDI and ITU indicators for electricity and internet use, and Global Findex for account ownership. Values used: electricity 66.9% (2005) and 99.5% (2023); internet use 2.39% (2005) and approximately 70% (2025); account ownership 35.2% (2011) and 89.0% (2024). Latest years differ by series. Source link
- [4]World Bank, India: Trends in Poverty, 2011–12 to 2022–23, 2025, together with the World Bank Poverty and Inequality Platform and World Development Indicators. Under the 2021 PPP lines, the 2022–23 headcounts are 5.3% at $3.00 a day, 23.9% at $4.20 and roughly four-fifths at $8.30. The first two figures are reported in the methodology note; the higher line is from the current PIP and WDI series. These thresholds should not be compared literally with older PPP-based dollar lines without rebasing. World Bank methodology | $8.30 WDI/PIP
- [5]The Three Indias are the author’s analytical segmentation, not an official classification. Population and household-income anchors are derived from PRICE’s 2020–21 household survey work, including its technical note on India’s middle class. Population shares and expenditure shares are rounded. Source link
- [6]Private-consumption equivalents are author calculations using the PRICE income and expenditure anchors, household-size assumptions and a 2021 PPP conversion. International comparisons use World Bank household final consumption expenditure per capita in constant 2021 international dollars. They compare private purchasing capacity, not public services, housing quality, health, education, social insurance or overall welfare. The Workforce India figure is in the broad range of lower-income economies; Ethiopia is an illustrative statistical reference, not a claim of economic equivalence. Source link
- [7]Ministry of Statistics and Programme Implementation, Periodic Labour Force Survey monthly dashboard and bulletin, July 2026. Under current weekly status for persons aged 15 and above, the all-India unemployment rate was 5.1%, labour-force participation rate 55.4% and worker-population ratio 52.5%. The unemployment rate does not measure hours, earnings quality, formality or occupational progression. Source link
- [8]NITI Aayog, India’s Booming Gig and Platform Economy: Perspectives and Recommendations on the Future of Work, 2022. It estimates 6.8 million gig workers in 2019–20, 7.7 million in 2020–21 and projects 23.5 million in 2029–30. The report describes the estimates and projections as indicative. Source link
- [9]Government of India and Press Information Bureau. PM Jan Dhan Yojana reached 58.90 crore accounts on 12 August 2026; PM MUDRA Yojana had sanctioned more than 59.14 crore loans by July 2026, with ₹41.71 lakh crore reported in the July financial-inclusion update. MUDRA is a cumulative loan count and can include repeat borrowers; it is not a count of unique borrowers. August factsheet | July financial-inclusion update
- [10]Government welfare-delivery sources. DBT Bharat reports cumulative transfers exceeding ₹53 lakh crore across schemes. PMGKAY provides free foodgrains to about 81.35 crore beneficiaries under the five-year extension from January 2024, with an estimated food-subsidy cost of about ₹11.8 lakh crore. One Nation One Ration Card makes NFSA food entitlements portable nationwide. Cumulative DBT is a delivery-scale measure, not annual discretionary cash. DBT PMGKAY ONORC DBT PMGKAY ONORC
- [11]Ministry of Statistics and Programme Implementation, NSS Report No. 508: Level and Pattern of Consumer Expenditure, 2004–05; and Household Consumption Expenditure Survey 2023–24, final report. MPCE values are nominal and survey design changed. PRICE/NCAER, Rajesh Shukla, ‘Evolution of Income Inequality in India Since Independence’, Working Paper 01–2025, is used only as corroborating household-income evidence; PRICE and World Inequality Database methods differ materially, so distributional conclusions are stated cautiously. HCES 2023–24 | PRICE working paper
- [12]Government of India, Economic Survey 2024–25, Chapter 12: Employment and Skill Development, drawing on Periodic Labour Force Survey data. Employment-status shares refer to workers aged 15 years and above under the usual-status measure. Source link
- [13]Sam Asher, Paul Novosad and Charlie Rafkin, ‘Intergenerational Mobility in India: New Measures and Estimates across Time and Social Groups,’ American Economic Journal: Applied Economics 16(2), 2024, pp. 66–98. The paper measures upward educational mobility and documents substantial differences across social groups and geographies. Source link
- [14]Research limitation. The essay does not claim that platform participation causes long-run mobility. Establishing that proposition requires longitudinal comparisons of net real earnings, hours, work-related costs, assets, skills, occupation and next-generation outcomes for comparable platform and non-platform workers.
- [15]Platform and workforce metrics are selected disclosed measures, not harmonised employment counts. Rapido reports 3.4m+ active captains; Ola states 1.5m+ driver-partners but does not present it as a current active metric; Uber India says it supports over 1m drivers; Swiggy disclosures show a delivery network of roughly 0.6–0.65m; Quess reports 482k+ professionals globally; Porter 3 lakh driver-partners per month; Shadowfax 2.9 lakh+ quarterly delivery partners; Delhivery 106k+ direct and indirect employment; and Urban Company over 59k service professionals. Eternal (Zomato), Blinkit, TeamLease and Zepto use their own reporting definitions and periods. These figures should not be summed. Rapido | Ola | Uber India | Swiggy | Quess | Porter | Shadowfax | Delhivery | Urban Company | Eternal FY25
- [16]Ricardo Adrogué and Martin D. Cerisola, ‘Brazil’s Long-Term Growth Performance—Trying to Explain the Puzzle’, IMF Working Paper 06/282, 2006. The paper notes that Brazilian real GDP growth averaged close to 7.3% in the 1960s and 1970s, but after the 1982 debt crisis annual growth over the following two decades was only about one-third of the 1960–80 average. IMF paper